Technology
Step 3. Analyzing the data
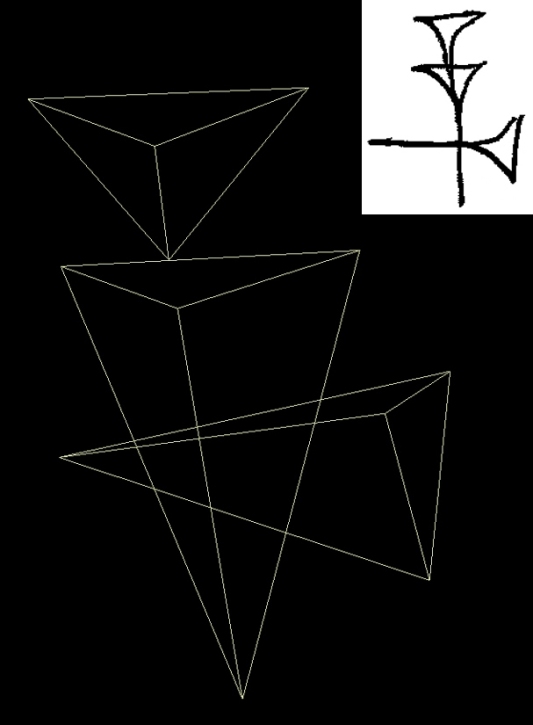 |
 The analysis software recreates each cuneiform symbol from the laser scan measurements into properly sized and spaced wedges, as shown here in perspective drawings along with a schematic of the symbol "An." The analysis software recreates each cuneiform symbol from the laser scan measurements into properly sized and spaced wedges, as shown here in perspective drawings along with a schematic of the symbol "An." |
Now that the data is collected, the third step is analysis. This involves organizing the data so that we can compare the sizes and shapes of each of the individual signs to one another across all of the tablets that have the same sign. Thus we can quantify things that cannot be easily if at all seen with the naked eye, as well as measure the similarities and differences among the signs. The details of each inscription may be too small, or the shapes might be too complicated, for the brain to abstract, categorize, hold in mind as a template and then search 3, 5 or 30 other tablets to determine how exactly it matches up with roughly similar shapes. Try thinking about 5 different fonts in your computer that represent the letter "S" and arrange them along a scale of similarity. Then think about what elements - curves, lines, thicknesses - overlap with one another and the shape details that make each one unique. Now imagine your letter "esses" as 3D object, some with flat bottoms resting on the page, some with rounded bodies, some flat below and crested on the other face, some with grooved surfaces, some convex, some concave. It is too much to handle, so we rely on quantification.
The statistics we use is called Generalized Procrustes Analysis, known as GPA. The aim is simple but the computations are difficult, which is why the approach has only recently become available for desktop machines. Basically, working sign by sign, GPA superimposes all of the landmark points we measured on top of one another by stretching them and rotating them in three-dimensional space to fit as one. This becomes an "average sign." Then, each individual sign is matched against this average and its differences from it are recorded. This allows us to see how much signs vary overall in a sample and precisely where each one differs - Is it in the depth of the impression, in the length of a particular stroke, the crossing point of two line, the shape of the tail end, etc.?
Go to Step 1, Step 2, Step 3.